 All-Sky Milky Way Panorama 2.0 is a digital compilation of over 3,000 images comprising the highest resolution digital panorama of the entire night sky yet created. Interactive zoom version. Credit & Copyright: Axel Mellinger (Central Mich. U) Publ. Astron. Soc. Pacific 121, 1180-1187 (2009).
Field of Science
-
-
RFK Jr. is not a serious person. Don't take him seriously.1 month ago in Genomics, Medicine, and Pseudoscience
-
-
-
The Site is Dead, Long Live the Site2 years ago in Catalogue of Organisms
-
The Site is Dead, Long Live the Site2 years ago in Variety of Life
-
-
What I read 20194 years ago in Angry by Choice
-
-
-
Histological Evidence of Trauma in Dicynodont Tusks6 years ago in Chinleana
-
Posted: September 07, 2018 at 08:00AM6 years ago in TelescopeFeed
-
Posted: July 21, 2018 at 03:03PM6 years ago in Field Notes
-
Why doesn't all the GTA get taken up?6 years ago in RRResearch
-
-
Harnessing innate immunity to cure HIV8 years ago in Rule of 6ix
-
What kind of woman would pray for health or use spiritual healing?8 years ago in Epiphenom
-
-
-
-
-
-
post doc job opportunity on ribosome biochemistry!9 years ago in Protein Evolution and Other Musings
-
-
Blogging Microbes- Communicating Microbiology to Netizens10 years ago in Memoirs of a Defective Brain
-
Re-Blog: June Was 6th Warmest Globally10 years ago in The View from a Microbiologist
-
-
-
The Lure of the Obscure? Guest Post by Frank Stahl12 years ago in Sex, Genes & Evolution
-
-
Lab Rat Moving House13 years ago in Life of a Lab Rat
-
Goodbye FoS, thanks for all the laughs13 years ago in Disease Prone
-
-
Slideshow of NASA's Stardust-NExT Mission Comet Tempel 1 Flyby13 years ago in The Large Picture Blog
-
in The Biology Files
Milky Way Panorama
 All-Sky Milky Way Panorama 2.0 is a digital compilation of over 3,000 images comprising the highest resolution digital panorama of the entire night sky yet created. Interactive zoom version. Credit & Copyright: Axel Mellinger (Central Mich. U) Publ. Astron. Soc. Pacific 121, 1180-1187 (2009).
Cloud Fraction
 In some parts of the world the difference in the amount of clouds over land versus ocean is so stark that the outlines of continents and other landmasses can be traced through observations of clouds alone. This image of October 2009’s cloud fraction (the fraction of an area covered by clouds) demonstrates the pattern. The measurements were collected by the Moderate Resolution Imaging Spectroradiometer (MODIS) on NASA’s Terra satellite. Colors range from blue (no clouds) to white (totally cloudy). -- Earth Observatory
Crescent Earth
 Illuminated crescent of Earth showing part of South America and Antarctica. Credits: ESA ©2009 MPS for OSIRIS Team MPS/UPD/LAM/IAA/RSSD/INTA/UPM/DASP/IDA
Hubble, Spitzer and Chandra Composite of the Milky Way's Galactic Center
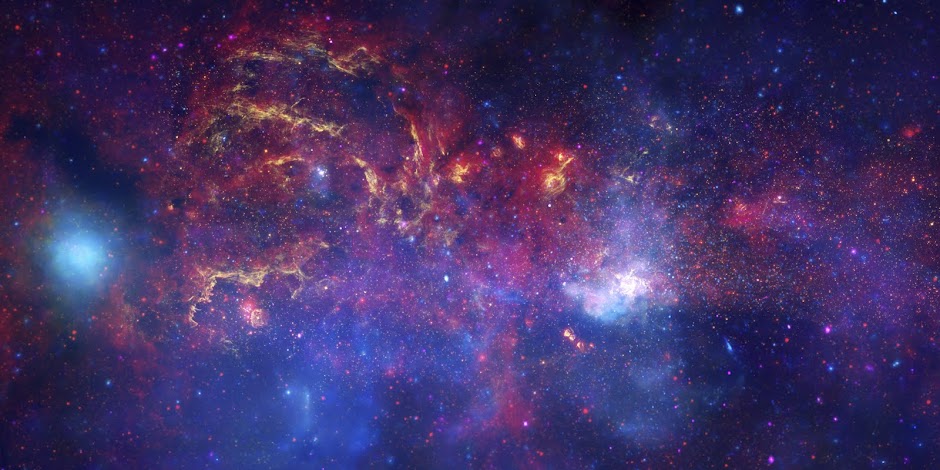 In celebration of the International Year of Astronomy 2009, NASA's Great Observatories -- the Hubble Space Telescope, the Spitzer Space Telescope, and the Chandra X-ray Observatory -- have produced a matched trio of images of the central region of our Milky Way galaxy. Each image shows the telescope's different wavelength view of the galactic center region, illustrating the unique science each observatory conducts. Credit: NASA/JPL-Caltech/ESA/CXC/STScI
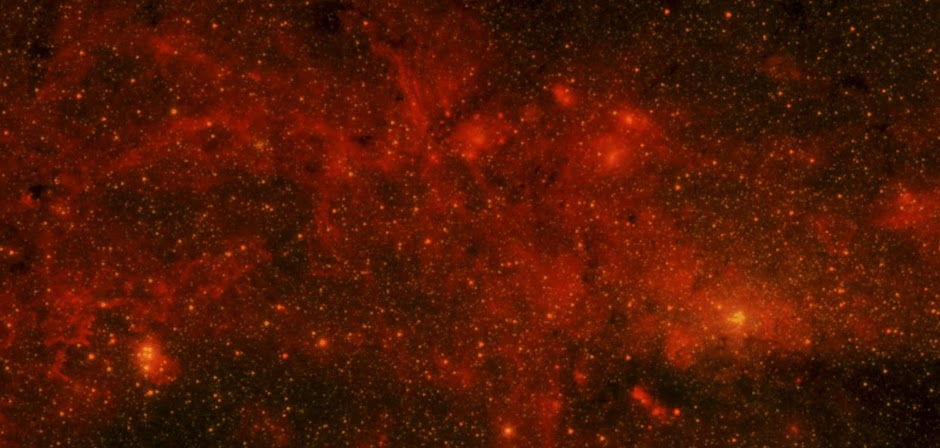 Spitzer's infrared-light observations provide a detailed and spectacular view of the galactic center region. The swirling core of our galaxy harbors hundreds of thousands of stars that cannot be seen in visible light. These stars heat the nearby gas and dust. These dusty clouds glow in infrared light and reveal their often dramatic shapes. Some of these clouds harbor stellar nurseries that are forming new generations of stars. Like the downtown of a large city, the center of our galaxy is a crowded, active, and vibrant place. Credit: NASA, JPL-Caltech, E. Churchwell (University of Wisconsin), SSC, and STScI
 X-rays detected by Chandra expose a wealth of exotic objects and high-energy features. In this image, pink represents lower energy X-rays and blue indicates higher energy. Hundreds of small dots show emission from material around black holes and other dense stellar objects. A supermassive black hole -- some four million times more massive than the Sun -- resides within the bright region in the lower right. The diffuse X-ray light comes from gas heated to millions of degrees by outflows from the supermassive black hole, winds from giant stars, and stellar explosions. This central region is the most energetic place in our galaxy. Credit: NASA/CXC/UMass/D. Wang et al.
 Although best known for its visible-light images, Hubble also observes over a limited range of infrared light. The galactic center is marked by the bright patch in the lower right. Along the left side are large arcs of warm gas that have been heated by clusters of bright massive stars. In addition, Hubble uncovered many more massive stars across the region. Winds and radiation from these stars create the complex structures seen in the gas throughout the image. This sweeping panorama is one of the sharpest infrared pictures ever made of the galactic center region. Credit: NASA, ESA, Q.D. Wang (University of Massachusetts, Amherst), and STScI
Hubble Image Showcases Star Birth in M83, the Southern Pinwheel
Hubble's new camera--the Wide Field Camera 3 (WFC3)-- captured a close-up view of the hundreds of thousands of mostly blue and red supergiant stars, hundreds of star clusters and swarms of globular star clusters in this image of in an arm and nucleous of Southern Pinwheel Galaxy. -- Press Release
 The image reveals in unprecedented detail the current rapid rate of star birth in this famous "grand design" spiral galaxy. The newest generations of stars are forming largely in clusters on the edges of the dark dust lanes, the backbone of the spiral arms. These fledgling stars, only a few million years old, are bursting out of their dusty cocoons and producing bubbles of reddish glowing hydrogen gas... Credit: NASA, ESA, and the Hubble Heritage Team (STScI/AURA).
 The image reveals in unprecedented detail the current rapid rate of star birth in this famous "grand design" spiral galaxy. The newest generations of stars are forming largely in clusters on the edges of the dark dust lanes, the backbone of the spiral arms. These fledgling stars, only a few million years old, are bursting out of their dusty cocoons and producing bubbles of reddish glowing hydrogen gas... Credit: NASA, ESA, and the Hubble Heritage Team (STScI/AURA).
Infrared Astronomical Satellite's View of the Sky
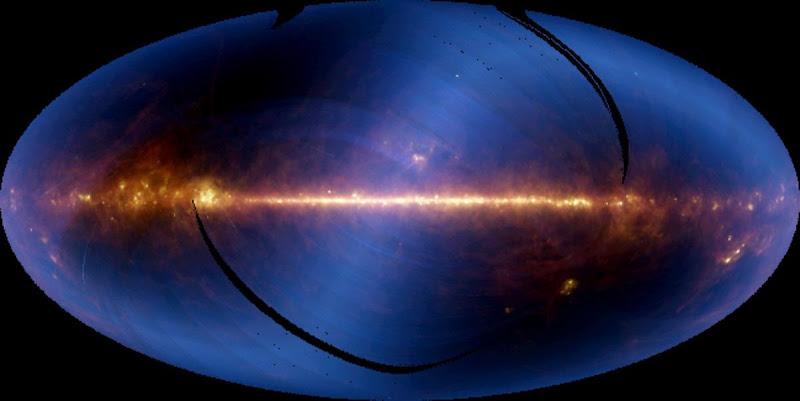
Nearly the entire sky, as seen in infrared wavelengths and projected at one-half degree resolution, is shown in this image, assembled from six months of data from the Infrared Astronomical Satellite, or IRAS. The bright horizontal band is the plane of our Milky Way galaxy, with the center of the galaxy located at the center of the picture. (Because of its proximity, the Milky Way dominates our view of the entire sky, as seen in this image. IRAS data processed to show smaller regions of the sky, however, reveal thousands of sources beyond the Milky Way.) The colors represent infrared emission detected in three of the telescope's four wavelength bands (blue is 12 microns; green is 60 microns, and red is 100 microns). Hotter material appears blue or white while the cooler material appears red. The hazy, horizontal S-shaped feature that crosses the image is faint heat emitted by dust in the plane of the solar system. Celestial objects visible in the photo are regions of star formation in the constellation Ophiucus (directly above the galactic center) and Orion (the two brightest spots below the plane, far right). The Large Magellanic Cloud is the relatively isolated spot located below the plane, right of center. Black stripes are regions of the sky that were not scanned by the telescope in its first six months of operation. Image Credit: NASA/JPL-Caltech
The Solar System...to Scale
 |
| A collection of artist's impressions and photo illustrations of the solar system. |
 All asteroids and comets visited by spacecraft as of November 2010. Credits: Montage by Emily Lakdawalla. Ida, Dactyl, Braille, Annefrank, Gaspra, Borrelly: NASA / JPL / Ted Stryk. Steins: ESA / OSIRIS team. Eros: NASA / JHUAPL. Itokawa: ISAS / JAXA / Emily Lakdawalla. Mathilde: NASA / JHUAPL / Ted Stryk. Lutetia: ESA / OSIRIS team / Emily Lakdawalla. Halley: Russian Academy of Sciences / Ted Stryk. Tempel 1, Hartley 2: NASA / JPL / UMD. Wild 2: NASA / JPL.
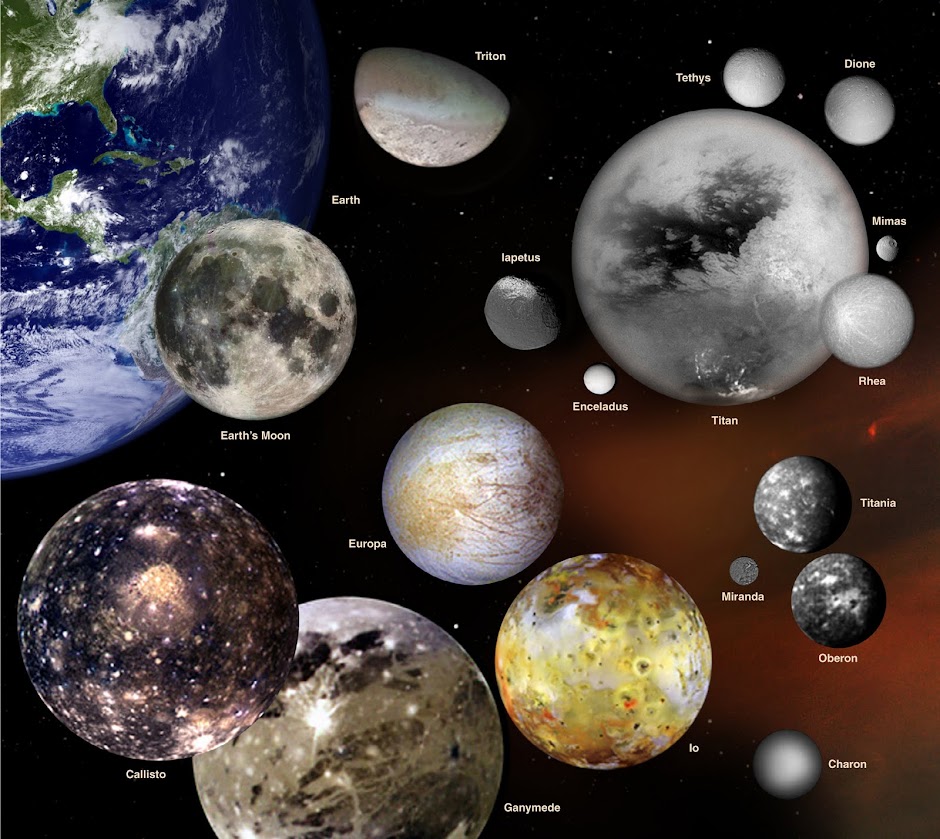
Moons of Our Solar System. This photo illustration shows selected moons of our solar system at their correct relative sizes to each other and to Earth. Pictured are Earth's moon; Jupiter's Callisto, Ganymede, Io and Europa; Saturn's Iapetus, Enceladus, Titan, Rhea, Mimas, Dione and Tethys; Neptune's Triton; Uranus' Miranda, Titania and Oberon and Pluto's Charon. Credit: NASA.
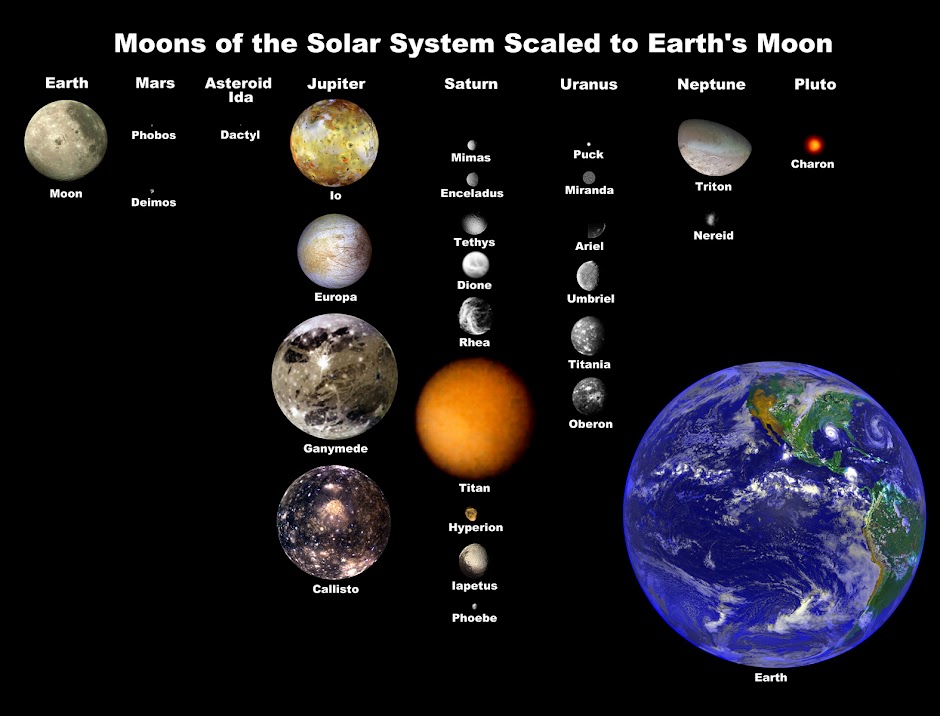
Moons of the Solar System. A selection of our solar system's natural satellites are shown here to scale compared to the Earth and its moon. Credit: NASA.
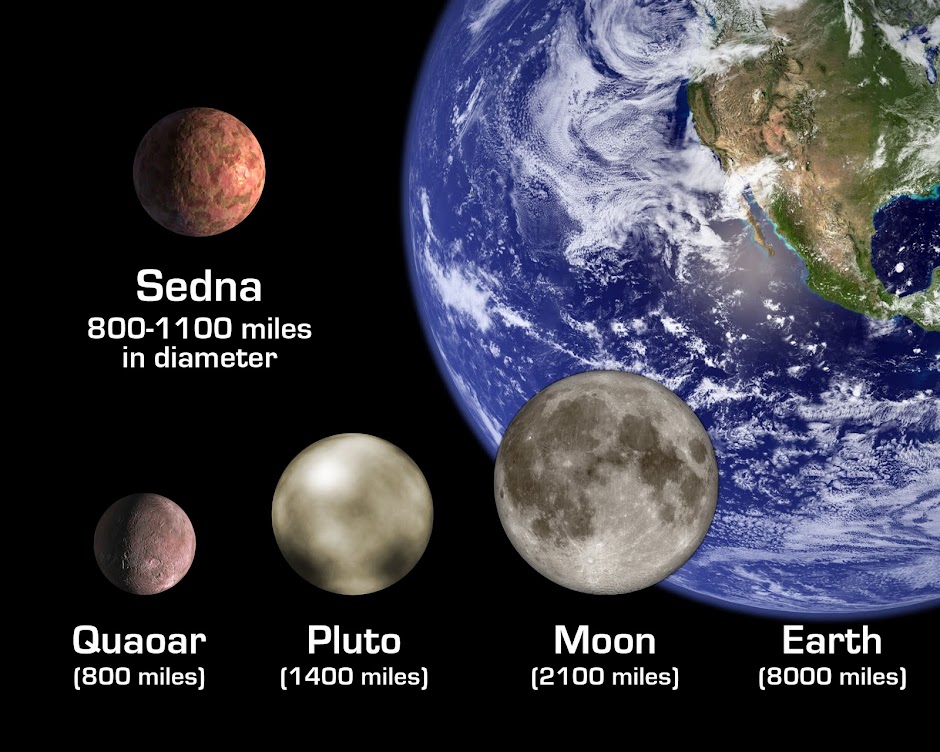
Sedna Size Comparison. The artist's rendition shows the planet-like object, dubbed 'Sedna,' in relation to other bodies in the Solar System, including Earth and its Moon; Pluto; and Quaoar, a planetoid beyond Pluto that was until now the largest known object beyond Pluto. The diameter of Sedna is slightly smaller than Pluto's but likely somewhat larger than Quaoar. Image Credit: NASA/JPL-Caltech/R. Hurt (SSC-Caltech)

Relative sizes of the 25 solar system objects smaller than the earth. Source: Wikipedia.

Terrestrial Planet Sizes. The terrestrial planets are the four innermost planets in the solar system; Mercury, Venus, Earth, and Mars. They are called terrestrial because they have a compact, rocky surface like the Earth's. The planets Venus, Earth, and Mars have significant atmospheres, while Mercury has almost none. This diagram shows the approximate relative sizes of the terrestrial planets. Distances are not to scale. Image Credit: Lunar and Planetary Institute.
 |
| The Relative Sizes of the Largest Solar System Objects - in the following order (to scale): Jupiter, Saturn, Uranus, Neptune, Earth, Venus, Mars, Ganymede, Titan, Mercury, Callisto, Io, The Moon, Europa, Triton, Eris, Pluto. Credit: Larry McNish. Source: The RASC Calgary Centre. |

100 Largest Objects in the Solar System. Source: Universe Sandbox

Rough visual comparison of Jupiter, Earth, and the Great Red Spot. Source: Wikipedia.

Gas Planet Sizes. Jupiter, Saturn, Uranus, and Neptune are known as the jovian (Jupiter-like) planets because they are all gigantic compared with Earth, and they have a gaseous nature like Jupiter's. The jovian planets are also referred to as the gas giants, although some or all of them might have small solid cores. This diagram shows the approximate relative sizes of the jovian planets. Image Credit: Lunar and Planetary Institute.

All Planet Sizes. This illustration shows the approximate sizes of the planets relative to each other. Outward from the Sun, the planets are Mercury, Venus, Earth, Mars, Jupiter, Saturn, Uranus, Neptune, and Pluto. Jupiter's diameter is about 11 times that of the Earth's and the Sun's diameter is about 10 times Jupiter's. Pluto's diameter is slightly less than one-fifth of Earth's. The planets are not shown at the appropriate distance from the Sun. Image Credit: Lunar and Planetary Laboratory

Title: Eight Planets and New Solar System Designations. Credit: International Astronomical Union. Source: APOD August 28, 2006.

w/o Designations. Credit: The International Astronomical Union/Martin Kornmesser. Source: HEIC.
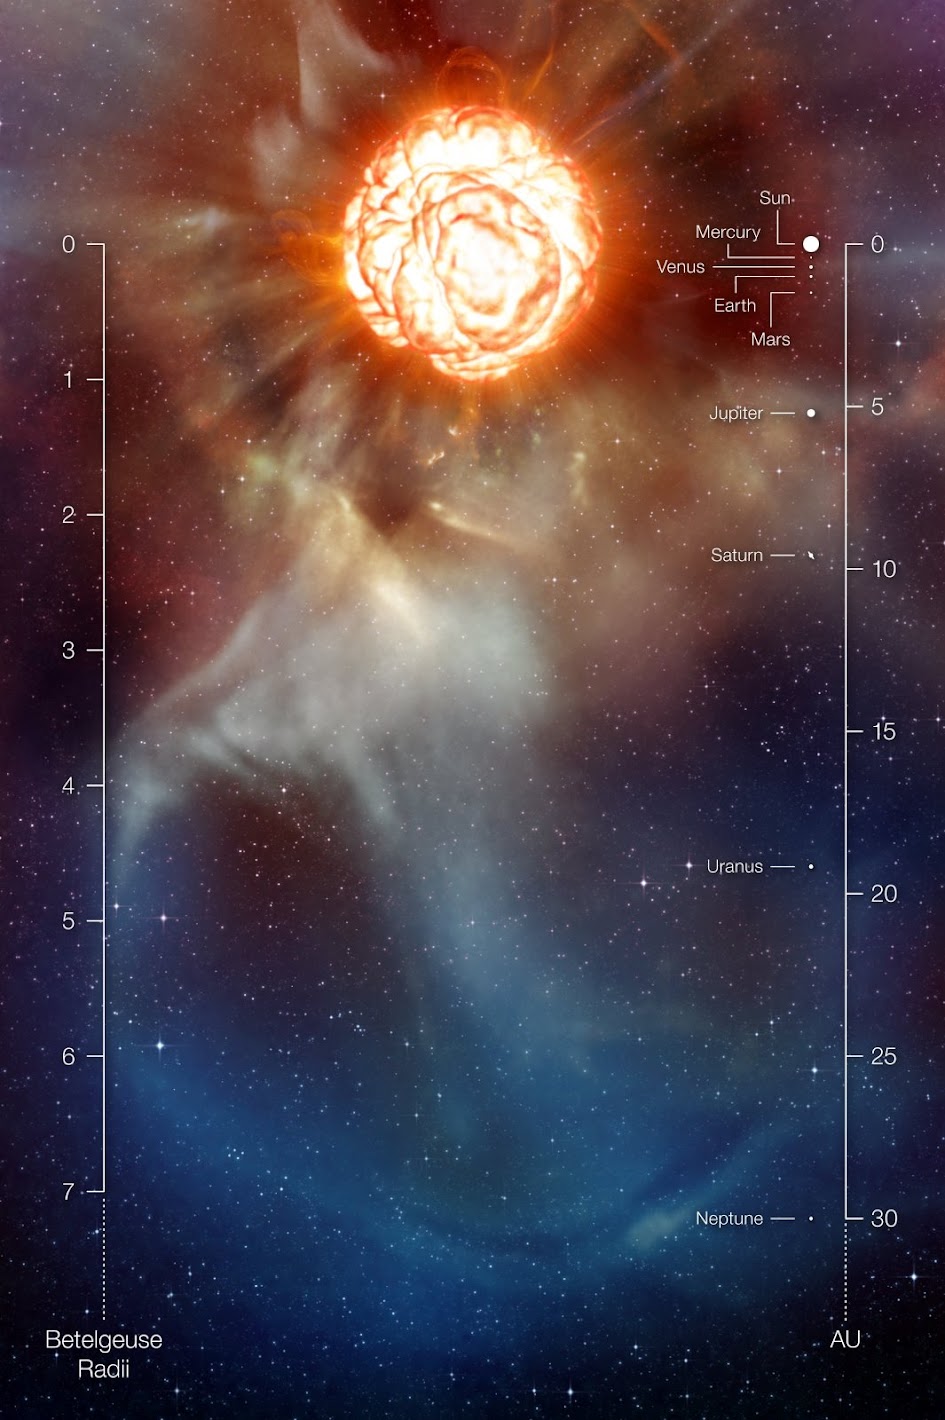
This artist’s impression shows the supergiant star Betelgeuse as it was revealed thanks to different state-of-the-art techniques on ESO’s Very Large Telescope, which allowed two independent teams of astronomers to obtain the sharpest ever views of the supergiant star Betelgeuse. They show that the star has a vast plume of gas almost as large as our Solar System and a gigantic bubble boiling on its surface. These discoveries provide important clues to help explain how these mammoths shed material at such a tremendous rate. The scale in units of the radius of Betelgeuse as well as a comparison with the Solar System is also provided. Credit: ESO


Diagram of our location in the Local Supercluster in a series of five star maps that show from left to right our location in the Solar System, in the Sun's neighborhood of stars, in the local area of the Milky Way galaxy, in the Local Group of galaxies, and in the Supercluster of galaxies. Credit: Wikipedia.
Subscribe to:
Posts (Atom)

_(cropped).jpg)


