Field of Science
-
-
RFK Jr. is not a serious person. Don't take him seriously.1 month ago in Genomics, Medicine, and Pseudoscience
-
-
-
The Site is Dead, Long Live the Site2 years ago in Catalogue of Organisms
-
The Site is Dead, Long Live the Site2 years ago in Variety of Life
-
-
What I read 20194 years ago in Angry by Choice
-
-
-
Histological Evidence of Trauma in Dicynodont Tusks6 years ago in Chinleana
-
Posted: September 07, 2018 at 08:00AM6 years ago in TelescopeFeed
-
Posted: July 21, 2018 at 03:03PM6 years ago in Field Notes
-
Why doesn't all the GTA get taken up?6 years ago in RRResearch
-
-
Harnessing innate immunity to cure HIV8 years ago in Rule of 6ix
-
What kind of woman would pray for health or use spiritual healing?8 years ago in Epiphenom
-
-
-
-
-
-
post doc job opportunity on ribosome biochemistry!9 years ago in Protein Evolution and Other Musings
-
-
Blogging Microbes- Communicating Microbiology to Netizens10 years ago in Memoirs of a Defective Brain
-
Re-Blog: June Was 6th Warmest Globally10 years ago in The View from a Microbiologist
-
-
-
The Lure of the Obscure? Guest Post by Frank Stahl12 years ago in Sex, Genes & Evolution
-
-
Lab Rat Moving House13 years ago in Life of a Lab Rat
-
Goodbye FoS, thanks for all the laughs13 years ago in Disease Prone
-
-
Slideshow of NASA's Stardust-NExT Mission Comet Tempel 1 Flyby13 years ago in The Large Picture Blog
-
in The Biology Files
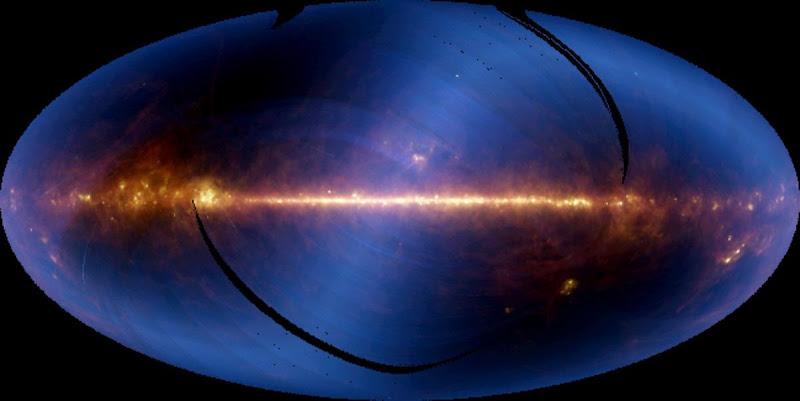
Infrared Astronomical Satellite's View of the Sky
Nearly the entire sky, as seen in infrared wavelengths and projected at one-half degree resolution, is shown in this image, assembled from six months of data from the Infrared Astronomical Satellite, or IRAS. The bright horizontal band is the plane of our Milky Way galaxy, with the center of the galaxy located at the center of the picture. (Because of its proximity, the Milky Way dominates our view of the entire sky, as seen in this image. IRAS data processed to show smaller regions of the sky, however, reveal thousands of sources beyond the Milky Way.) The colors represent infrared emission detected in three of the telescope's four wavelength bands (blue is 12 microns; green is 60 microns, and red is 100 microns). Hotter material appears blue or white while the cooler material appears red. The hazy, horizontal S-shaped feature that crosses the image is faint heat emitted by dust in the plane of the solar system. Celestial objects visible in the photo are regions of star formation in the constellation Ophiucus (directly above the galactic center) and Orion (the two brightest spots below the plane, far right). The Large Magellanic Cloud is the relatively isolated spot located below the plane, right of center. Black stripes are regions of the sky that were not scanned by the telescope in its first six months of operation. Image Credit: NASA/JPL-Caltech